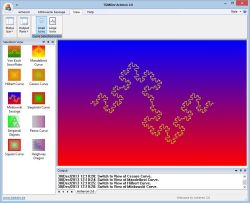
The Von Koch Curve, better known as Von Koch snowflakes, are perhaps the more beautiful fractal curves.
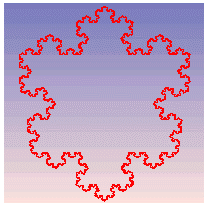
Construction Back to Top
The construction of the curve is fairly simple.
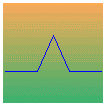
A straight line is first divided into three equal segments. The middle segment is removed and replaced by two segments having the same length to generate an equilateral triangle. Applying such a 4-sides generator to a straight line leads to this:
This process is then repeated for the 4 segments generated at the first iteration, leading to the following drawing in the second iteration of the building process:
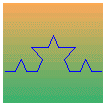
The third iteration already gives a nice picture:
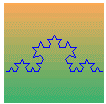
Increasing the iteration number provides more detailed drawings. However, above 8 iterations, the length of the segments becomes so small ( in fact, close to a single pixel) that further iterations are useless, only increasing the time of curve drawing.
Properties Back to Top
- Curve Length
- Curve Area
- Fractal Dimension
- Self-Similarity
The length of the Von Koch curve increases at each iteration. On each iteration, the size of the segments is divided by three and the number of segments is multiplied by four, hence a length increase by 4/3 with each iteration.
Note: the figures are valid for 'classical' Von Koch curves, for which the similarity ratio is standard.
Assuming a unit length for the starting straight line segment, we obtain the following figures:
| Iteration Number |
Segment Length |
Segment Number |
Curve Length |
|---|---|---|---|
| 1 | 1 | 1 | 1.00 |
| 2 | 1/3 | 4 | 1.33 |
| 3 | 1/9 | 16 | 1.77 |
| 4 | 1/27 | 64 | 2.37 |
| 5 | 1/81 | 256 | 3.16 |
| 6 | 1/243 | 1024 | 4.21 |
| ... | ... | ... | ... |
| 10 | 1/19683 | 262144 | 13.31 |
| 25 | 1/2.82e-11 | 2.81e+14 | 996.62 |
| 50 | 1/2.39e-23 | 3.17e+29 | 1324335.72 |
| 100 | 1/1.71e-47 | 4.02e+59 | 2338486807656.00 |
Of course, the figures at the bottom of the table does not have any physical meaning if we speak about actually drawing such a curve as there are no physical objects of that size ... but they show a really amazing property of these curves: as the number of iteration increases, the curve length tends to infinity while it is enclosed in a finite area !!!
As said above, the Von Koch curve is enclosed in a finite area.
Putting aside the very first step of curve drawing which is a simple straigth line, we consider the area of the first equilateral triangle as a unit surface.
On the next step, four small triangles are added, one on each segment of the curve. The surface of these rectangles is one ninth of the unit surface of the triangle drawn at the preceding iteration.
The area of the curve on the next iteration continues to increase but to a smaller extent: 16 small triangles are added but their area are now 81 times smaller than the very first triangle of the Von Koch curve.
The following figures show the area increase:
| Iteration Number |
Triangle Number |
Triangles Area |
Curve Area |
|---|---|---|---|
| 1 | 0 | 0 | 0.00 |
| 2 | 1 | 1 | 1.00 |
| 3 | 4 | 0.44444 | 1.44444 |
| 4 | 16 | 0.19753 | 1.64197 |
| 5 | 64 | 0.08779 | 1.72976 |
| ... | ... | ... | ... |
| 10 | 65536 | 0.00152 | 1.79878 |
| 15 | 67108864 | 2.64014E-05 | 1.79997 |
| 20 | 68719476736 | 4.57841E-07 | 1.79999 |
Mathematically, it gives:
S = 1 + (4/9)n where n is the number of iteration after the one drawing the first triangle.
At infinite iteration, the curve approachs the limit of that equation:
S = (4/9) / ( 1 - (4/9)) = 0.8
Still, this very interesting property of the Von Koch curve: its area converges rapidly to a finite limit while the total length of the segments that composed that curve have no limit.
The fractal dimension is computed using the Hausdorff-Besicovitch equation:
D = log (N) / log ( r)
Replacing r by three (as each segment is divided by three on each iteration) and N by four (as the drawing process yields 4 segments) in the Hausdorff-Besicovitch equation gives:
D = log(4) / log(3) = 1.26185
This property means that every part of the curve have the same overal character than the whole picture.
All Variations described are available using Acheron 2.0
The construction of the Von Koch curve allows numerous variations.
- Iteration Level
- Base Geometrical Figure
- Drawing Direction
The 4-sides generator can be directed inwards or outwards. This can give, combined with varying ratio ( see below), very interesting patterns.
The following curves were obtained using the same attributes
- Recursion Level: 4
- Similarity Ratio: 425
- Base Figure: Square
and then applying three different directions: inside, outside and random.
Inside 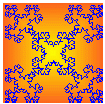
Outside 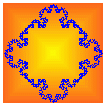
Random 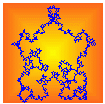 Note: in this figure, at each step of the different iterations, the direction of drawing is choosen at random. The actual figure obtained is then always unique ...
Note: The software always performed a curve scaling to fit the curve to the drawing area, whatever the actual area required to draw the curve. This explain the apparent difference between Inside and Outside variations.
- Similarity Ratio
- Recursion Level: 5
- Direction: Outside
- Base Figure: Hexagon
- Drawing Grain
This is of course the most basic variation for the drawing of the curve. Up to 8 iterations can be performed. Above this limit, the length of the different line segments comes down close to a single pixel, meaning that any increase would not yield a significantly more detailed drawing.
The straight line used for the construction of the Von Koch curve can be replaced by a triangle, a square or any other geometrical figure. The four-sides generator is then applied to each side of the base figure.
Here is what is generated with the fourth first basic geometrical figures:
| Triangle | 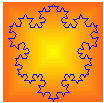
|
Square | 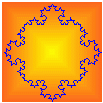
|
| Pentagon | 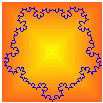
|
Hexagon | 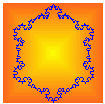
|
The height of the triangle generated by the drawing process is determined by the similarity ratio. The similarity ratio is expressed in 10th of percent of the line segment before the drawing process. The ratio that give a triangle height equal to the segment length is then 333.
This ratio can take value from 200 to 1000. The more below 333, the more the curve is flat and without big interest. The higher the ratio, the bigger is the curve, exploding outside its limit above 600.
The following curves were obtained using the same attributes
and applying three different similarity ratio.
| Value: 200 | 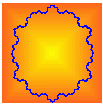
|
Value: 300 | 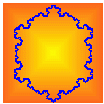
|
| Value: 400 | 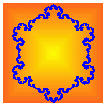
|
Value: 500 | 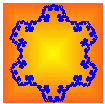
|
| Value: 600 | 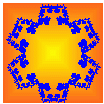
|
Value: 700 | 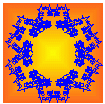
|
| Value: 800 | 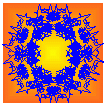
|
Value: 900 | 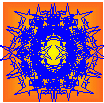
|
In the original Von Koch curve, the drawing grain is an equilateral triangle. The iteration process can be conducted with a square grain, leading to a quite different curve. I don't know if that curve got a name but as its drawing is similar to the original Von Koch curve, I set this grain as a variation of the original curve.
This gives the following results:
| Iteration 1 | 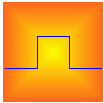
|
Iteration 2 | 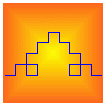
|
| Iteration 3 | 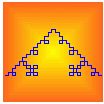
|
Iteration 4 | 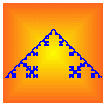
|
 Born: 25 Jan 1870 in Stockholm, Sweden
Died: 11 March 1924 in Danderyd, Stockholm, Sweden
Niels Fabian Helge von Koch attended a good school in Stockholm, completing his studies there in 1887. He then entered Stockholm University.
Von Koch spent some time at Uppsala University from 1888. He was a student of Mittag-Leffler at Stockholm University. Von Koch's first results were on infinitely many linear equations in infinitely many unknowns. In 1891 he wrote the first of two papers on applications of infinite determinants to solving systems of differential equations with analytic coefficients. The methods he used were based on those published by Poincaré about six years earlier. The second of von Koch's papers was published in 1892. Von Koch was awarded a doctorate in mathematics by Stockholm University on 26 May 1892.
Between the years 1893 and 1905 von Koch had several appointements as an assistant professor of mathematics. Von Koch was then appointed to the chair of pure mathematics at the Royal Technological Institute in Stockholm. In July 1911 von Koch succeeded Mittag-Leffler as professor of mathematics at Stockholm University.
Von Koch is famous for the Koch curve which appears in his paper Une méthode géométrique élémentaire pour l'étude de certaines questions de la théorie des courbes planes published in 1906.
The first person to give an example of an analytic construction of a function which is continuous but nowhere differentiable was Weierstrass. At the end of his paper, von Koch gives a geometric construction, based on the von Koch curve, of such a function which he also expresses analytically.
Von Koch also wrote papers on number theory, in particular he wrote several papers on the prime number theorem.
Biography From School of Mathematics and Statistics - University of StAndrews, Scotland
