Understanding the flow and verifying the performance of the execution of a process or a function is a critical step to assess that the application runs perfectly as expected.
Modern IDE, amongst others Visual Studio, provides tools like breakpoints, stepping through code, inspecting process variables during debugging sessions. Despite the power of the debugging capabilities, one of the classical straightforward and effective techniques to trace the logic of an application is the use of the function OutputDebugString, that renders messages in the order of appearance during the flow of the process. This simple technique gives an easy way to monitor and trace the flow of execution with very low interference with the execution of the process. Here is how to do it very easily ...
Simple use of the function OutputDebugString
The simplest way to use this function is to insert some calls where tracing is required to assess that the process is running as expected.
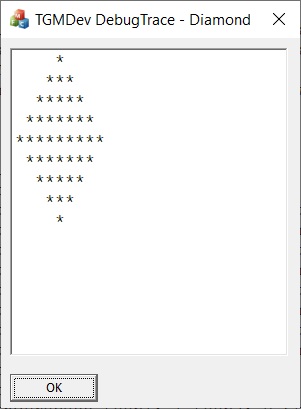
The process here is the classical drawing of a diamond in a control…
void MyClass::DrawDiamond()
{
  int nMax = 9;
  std::wstring wstrDiamond;
  for (int x = -nMax / 2; x <= nMax / 2; x++)
  {
    std::wstring wstr = std::format(L"{}{}\r\n", std::wstring(std::abs(x), L' '), std::wstring(nMax - 2 * std::abs(x), L'*'));
    wstrDiamond += wstr;
  }
  SetDlgItemText(IDC_OUTPUT, wstrDiamond.c_str());
}
And it gives the nice drawing of a very simple diamond !!!
During the debuggin sessions, it's quite common to add some calls to ::OutputDebugString to understand what happens:
Adding these lines is straightforward:
// Example C++ Code
wstr = std::format(L"Loop x: {} First String: ::{}:: Second String: ::{}:: \n", x, std::wstring(std::abs(x), L' '), std::wstring(nMax - 2 * std::abs(x), L'*'));
::OutputDebugString(wstr.c_str());
You got a clear view of the code execution in the Output Window:
Loop x: -4 First String: :: :: Second String: ::*::
Loop x: -4  First String: ::    :: Second String: ::*::
Loop x: -3  First String: ::   :: Second String: ::***::
Loop x: -2  First String: ::  :: Second String: ::*****::
Loop x: -1  First String: :: :: Second String: ::*******::
Loop x: 0  First String: :::: Second String: ::*********::
Loop x: 1  First String: :: :: Second String: ::*******::
Loop x: 2  First String: ::  :: Second String: ::*****::
Loop x: 3  First String: ::   :: Second String: ::***::
Loop x: 4  First String: ::    :: Second String: ::*::
So far so good…
DebugTrace Namespace
The DebugTrace namespace is a very simple namespace that takes care of all the little details that make debugging simpler and more powerful while requiring much less typing.
One-Liner calls
Addition of Carriage return
Conversion of std::wstring to wchar_t
Indentation of debug messages
Computation of process duration
Execution of debug functions
Availability only in debug mode
Calling ::OutputDebugString in release mode does not incur significant overhead (except in tight loops) to the performance of an application. With DebugTrace, in release mode, you don't have to worry about remaining orphan calls of DebugTrace functions in your code: the compiler will not generate any code related to these calls. Nothing new, but the one-liner calls make it very easy. When going back to a debugging session, the debug tracing will be fully available…
One-liner call to Output window
The functions of the DebugTrace namespace allow to do the same, with less typing and worries about the bits and tips for getting the debug strings in the output window.
You don't have to add a carriage return and add the .c_str() required when working with STL strings. Much easier and much less typing.
As simple as:
DBG_LOG(wstr);
Checking for functions calls and calling sequence
When debugging newly added code, I often check if the functions are called as expected.
So, the functions are always structured this way with the DBG_LOG at the entry and an other one at the Exit (shown in bold, here below)
Void MyClass::DrawDiamond()
{
  DBG_LOG(L"Entry Point MyClass::DrawDiamond");

  int nMax = 9;
  std::wstring wstrDiamond;

  for (int x = -nMax / 2; x <= nMax / 2; x++)
  {
    std::wstring wstr = std::format(L"{}{}\r\n", std::wstring(std::abs(x), L' '), std::wstring(nMax - 2 * std::abs(x), L'*'));

    wstrDiamond += wstr;
  }

  SetDlgItemText(IDC_OUTPUT, wstrDiamond.c_str());

  DBG_LOG(L"Exit Point MyClass::DrawDiamond");
}
With the STL library, it's easy to add some data (as return value or anything valuable to check the function.
As:
DBG_LOG(std::format(L"Exit Point MyClass::DrawDiamond Stars : {}", nMax));
With output:
Exit Point MyClass::DrawDiamond Stars : 9
Checking functions performance
Performance can be checked very easily with a few keyboard strokes...
Simply replace the first call DBG_LOG by DBG_TMB (as Time Beginning) and the last call by DBG_TME (as Time End)
The parameter DBG_TIME_CAST can be set to DBG_MICROSEC_PRECISION to get performance down to the microseconds (see DebugTrace.h).
The output will be:
Entry Point MyClass::DrawDiamond
...
Exit Point MyClass::DrawDiamond - Execution Time: 6336us
Of course, adding data to the debug string can be combined with the performance measurement…
With:
DBG_TME(std::format(L"Exit Point MyClass::DrawDiamond Stars : {}", nMax));
You got in the debug window :
Exit Point MyClass::DrawDiamond Stars : 9 - Execution Time: 17944us
Execution visualization by indentation
As done when coding, it's often easier to visualize the different calls with indentation.
The IND macros (IND as Indentation) are the following:
DBG_IND_LOG: Standard message with indentation;
DBG_IND_TMB: Standard message with indentation and time start;
DBG_IND_TME: Standard message with indentation and execution duration
Four different indentations processing are available, that all modify a tab counter, used to build a string with the requested number of tabs before the actual log message:
DBG_RESET: Reset the level of indentation (tab count reset to 0)
DBG_KEEP: Keep the level of indentation
DBG_INCR: Increase the level of indentation before displaying the log message
DBG_DECR: Decrease the level of indentation after displaying the log message
Typically, DBG_RESET is used on entry of a function, DBG_INCR to start an indentation, DBG_DECR to mark the end of an indentation and DBG_KEEP between DBG_INCR and DBG_DECR to log something in between…
Note that a DBG_INCR must fit a DBG_DECR to maintain consistency in the computation of the process identation.
Here is a sample that shows the way to use this feature with a function MyClass::DoLengthyProcess();
Basically the function a simply three embedded loops with a sleep time of 100ms.
Note that the actual time is not the sum of the the sleep times (8 * 100 ms) as
o std::this_thread::sleep_for(100ms) guarantees a minimum duration but not the exact timing (the wake-up time is dependent of the OS scheduler)
o the OS does not immediately resume the thread when duration is elapsed
o Windows ticks rate is around 15 ms (but varies with version)
As seen in the code, the DBG_IND_LOG, DBG_IND_TMB and DBG_IND_TME can be combined with a string message containing {} for dynamic parameters.
Execution of Debug functions
Often, it is interesting to display the internal and technical content of a data storage (whatever its type, struct, map, vector, array, ..) to ensure that the process of updating/modifying/handling the storage is running fine.
Here is a basic sample that explain how to execute a custom debug function.
Suppose a function that update a vector of tuple
So, it's quite common to write such functions to verify the data content during debugging sessions just to verify that all goes right or understand what goes wrong !!! Of course, these calls are removed automatically in release mode. In my naming convection, all these function names start with Debug.
As an example, here is the function to display the content of the tuple vector of the function decribed above:
Is just added before the last call DBG_TME in the function InitVectorData…
Running the function InitVectorData gives the following output, that shows that all is initialized as expected:
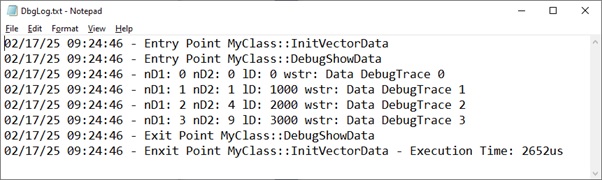
Entry Point MyClass::InitVectorData
Entry Point MyClass::DebugShowData
nD1: 0 nD2: 0 lD: 0 wstr: Data DebugTrace 0
nD1: 1 nD2: 1 lD: 1000 wstr: Data DebugTrace 1
nD1: 2 nD2: 4 lD: 2000 wstr: Data DebugTrace 2
nD1: 3 nD2: 9 lD: 3000 wstr: Data DebugTrace 3
Exit Point MyClass::DebugShowData
Exit Point MyClass::InitVectorData - Execution Time: 1390us
Of course, the line DBG_EXEC can be commented out if not needed anymore or left like that…
Time stamping
For output to debug window, the time stamping is not implemented as it is provided directly by Visual Studio (by click on the icon 'Show Timestamp')
Output to Text File
Since years, I distributed a freeware called Isanaki, a solver of Sudoku grids. A user sent me a complain, pretending that my application was buggy in a given user manipulation with the mouse. Trying on my computer, everything went fine. As the guy did not accept the use of remote control software, I sent him a modified version of the application that trace everything to a text file. One day after, I found the guilty code due to a totally unexpected way of using the mouse.
The namespace DebugTrace can activate such a feature in a few seconds… Simply change the parameter DEBUG_TRACE (in DebugTrace.h) from STANDARD_DEBUG to EXTENDED_DEBUG. That's it !!!
After recompiling, the application redirects all the DebugTrace messages to a file named DbgLog.txt.
Here is a typical excerpt in Notepad:
Note that the file is automatically created at the first DebugTrace log addition (if it does not exist). From that time on, the DebugTrace logs are always appended to the same file. So, delete or move the file between two debugging sessions to avoid continuous additions…..
Performance of Debug Tracing
I compare the speed of the application using a practical example: a Windows application that displays robots (as balls) sliding over a circle and colliding all the times. The robots positions and collisions are computed about 33 times per second (cycle time of 30 ms) and are heavily traced.
When one instance is running attached to the Visual Studio debug window and the other one is started outside Visual Studio, both applications are running exactly at the same rate despite the generation of 2000 lines of DebugTrace every second !!
The situation was a little bit different when the output was a text file. Clearly, the application feeding the text file was running slower. With an average 1200 lines per second and a text file of about 60 Mb after 10 minutes of debug tracing …
Practical Information
To use the DebugTrace namespace, simply copy the two files DebugTrace.cpp and DebugTrace.h in your application directory and add these files to the project.
Add the following line to declare the namespace in the calling files or in your main project include file.
#include "DebugTrace.h" // Declaration of DebugTrace Namespace
The Project properties must be updated to use the DebugTrace Name space:
Mainly:
Configuration Properties | General | C++ Language Standard: ISO C++ 20 Standard
Configurations Propeties | Adavanced | Character Set: Use Unicode Character Set
Of course, the code can be modified to MBCS by replacing std::wstring by std::string.
Conclusion
The DebugTrace namespace provides one-liner functions for logging debug messages in Windows applications using the ::OutputDebugString function from the Windows API. ::OutputDebugString is a function provided by kernel32.dll that sends a message to the debug output stream.
This output can be captured and displayed by:
Visual Studio's Output window (when debugging)
Sysinternals DebugView (a standalone debug output viewer)
WinDbg (Windows Debugger)
Custom applications listening to debug output
::OutputDebugString is not limited to Visual Studio and MFC applications. It can be used in:
Win32 API applications
Console applications
WinForms (.NET) applications
WinUI 3 and UWP applications
Any other Windows application that links against kernel32.dll
Note that the DebugTrace namespace has been tested only in Visual Studio.